
Attendees at Tessitura’s TLCC conference were invited to find their conference segment with the Baker Richards Sort-O-Tron.
The Sort-O-Tron asks a short quiz and places attendees in one of six segments intended to reveal something about how they approach conferences: Networker, Trailblazer, Visionary, Scholar, Achiever, or Coach. The segment names are self-explanatory, but a fuller explanation was available to attendees.
To match their taste, attendees were given the choice to have questions asked ‘straight up’, or using playful language – the meaning of the question and answers, and the resulting moves, were the same no matter which variant was chosen.
Points on the compass
When building a segmentation model, an important question to answer is – ‘how will people be placed in a segment?’. Sometimes it may be according to behaviour recorded in a CRM, or from demographic data enrichment. The segment may be allocated through a probability calculation, a cumulative score, a stated preference, or – where there is a large amount of data to draw on – AI may be appropriate to derive the segment.
Different models may choose to place the respondent confidently within a single segment, within hierarchical segments, or record a probability / confidence score.
Our approach
Commonly for example, when we build a needs-based or attitudinal segmentation model, we underpin it with behavioral signals too. As well as segmenting and sizing the total addressable market :
- each audience member or visitor on the database will first be placed in a lower-confidence segment based on statistically-derived behavioural proxies (i.e. what does this segment typically do?)
- When the visitor answers questions which reveal what they think or need, that data will either be combined, or may take precedence, giving us higher confidence of their segment.
Whether an organisation chooses to personalise communications, or make decisions based on the lower-confidence segments then becomes a choice – typically based on how much is at stake – but it means that from the start, without any customer having to answer our ‘golden questions’, the segmentation model has full coverage of the audience.
Double-axis approach for TLCC
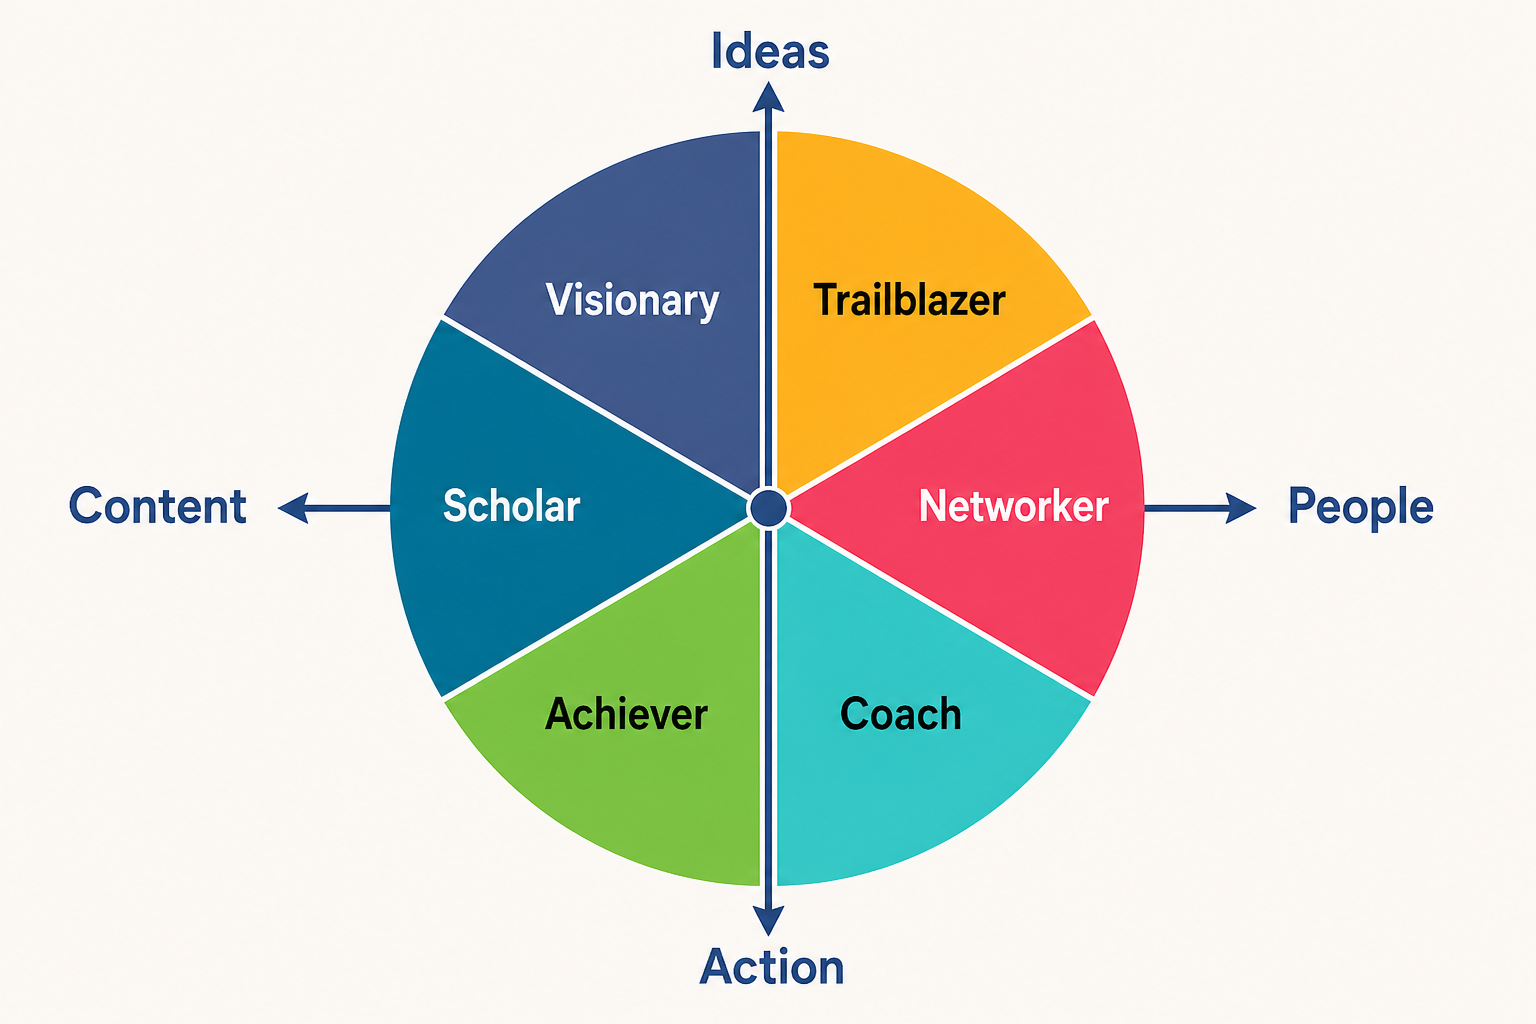
In reality, it would be unusual to have six equally sized segments in a market. For TLCC, we defined two axes, with every choice answering two underlying questions:
- Are you leaning toward content or toward people? (The west-east axis)
- Are you leaning toward action or toward ideas? (The north-south axis)
Each question offers multiple possible answers. For ease of display on a mobile phone in portrait mode, we offered three answer options per question, or if no answer was suitable, the question could be skipped.
Each answer carries two integer weights: one for Content↔People, one for Action↔Ideas. In this model, those weights sit in the range −3 (west/south) to +3 (north/east)
Choosing answer A, for example, doesn’t “count as one vote for Networker.” It nudges the respondent a specific distance along both axes, and some nudges are stronger than others.
For example, from TLCC (straight-up wording):
When the schedule is released, you tend to…
- Plan carefully → strong pull toward Content (−2, 0)
- Look first for forward-looking keynotes → mild Content, strong Ideas (−1, +2)
- See who else is going → strong pull toward People (+2, 0)
Each respondent answers seven questions. After the last one, the co-ordinates are (sum of all X weights, sum of all Y weights). If this all sounds very technical, imagine it as a map at a festival, divided into zones to meet different needs or tastes. Each step you take in the direction of a particular zone, reveals something about who you are.
Our map is cut into six equal wedges, like a pie. Each wedge is permanently assigned to one segment:
| Direction on the map (in plain language) | Segment |
|---|---|
| Toward People | Networker |
| Toward People + Ideas | Trailblazer |
| Toward Content + Ideas | Visionary |
| Toward Content | Scholar |
| Toward Content + Action | Achiever |
| Toward People + Action | Coach |
In this example, distance from the centre is married with proximity to a neighbouring ‘wedge’ (segment), to determine confidence. If you are placed in one segment but lean towards another, that can be useful in later targeting. This is where using a geometric approach to placing the segment allows us to record nuance.
What the maths does not decide
The compass determines placement, but we still need a human in the loop. The system does not:
- invent the axes “Content ↔ People” and “Action ↔ Ideas”
- decide that those six names are the right attenders for TLCC
- write the tips that sit under Networker, Achiever, and the rest – i.e., what outcome or effect should the segmentation have?
- judge alone which answer options deserve a −3 versus a −1, though in this instance we used a model to help weight the answers to ensure equitable routes to each segment
Those choices were made by an expert analyst in our team, when the model was authored: which tensions matter for this community, how strongly each behaviour should pull, what each territory is called, and what advice is useful on a busy conference floor.
Segmentation is at the heart of audience alignment
Creating a common language – typically of four to six audience segments – grounded in data, and recognised by the whole organisation from programming to front-of-house, is an essential foundation for audience alignment. Audience alignment – delivering what your audience want, and talking to them where they’re at – is a key underpinning of revenue success.
Our segmentations are super-charged by execution through the Advantage Dashboard.